- Published on
Home Temperature Monitor
- Authors

- Name
- Fodor Zsolt
- Github
- @github
Introduction
I heat my home with wood, and I wanted an easy way to know when the fire has gone out — no more waking up to a cold house. So I put together a small monitor that watches the water temperature in the heating loop and the outside temperature.
The system uses a NodeMCU with DS18B20 sensors (one in the water loop, one outside). The NodeMCU uploads readings to a Supabase database so everything is logged centrally.
A lightweight Next.js PWA pulls the data from Supabase and shows live charts and status on your phone or laptop. The whole stack is simple, reliable, and helps me see at a glance whether the stove is still burning or has cooled down.
Below I walk through the hardware, the NodeMCU firmware, the Supabase setup, and the Next.js PWA — plus a few tips if you want to build the same thing.
The architecture
The system has 3 main parts:
- The NodeMCU and the temperature sensors
- The supabase database
- The PWA to show the data
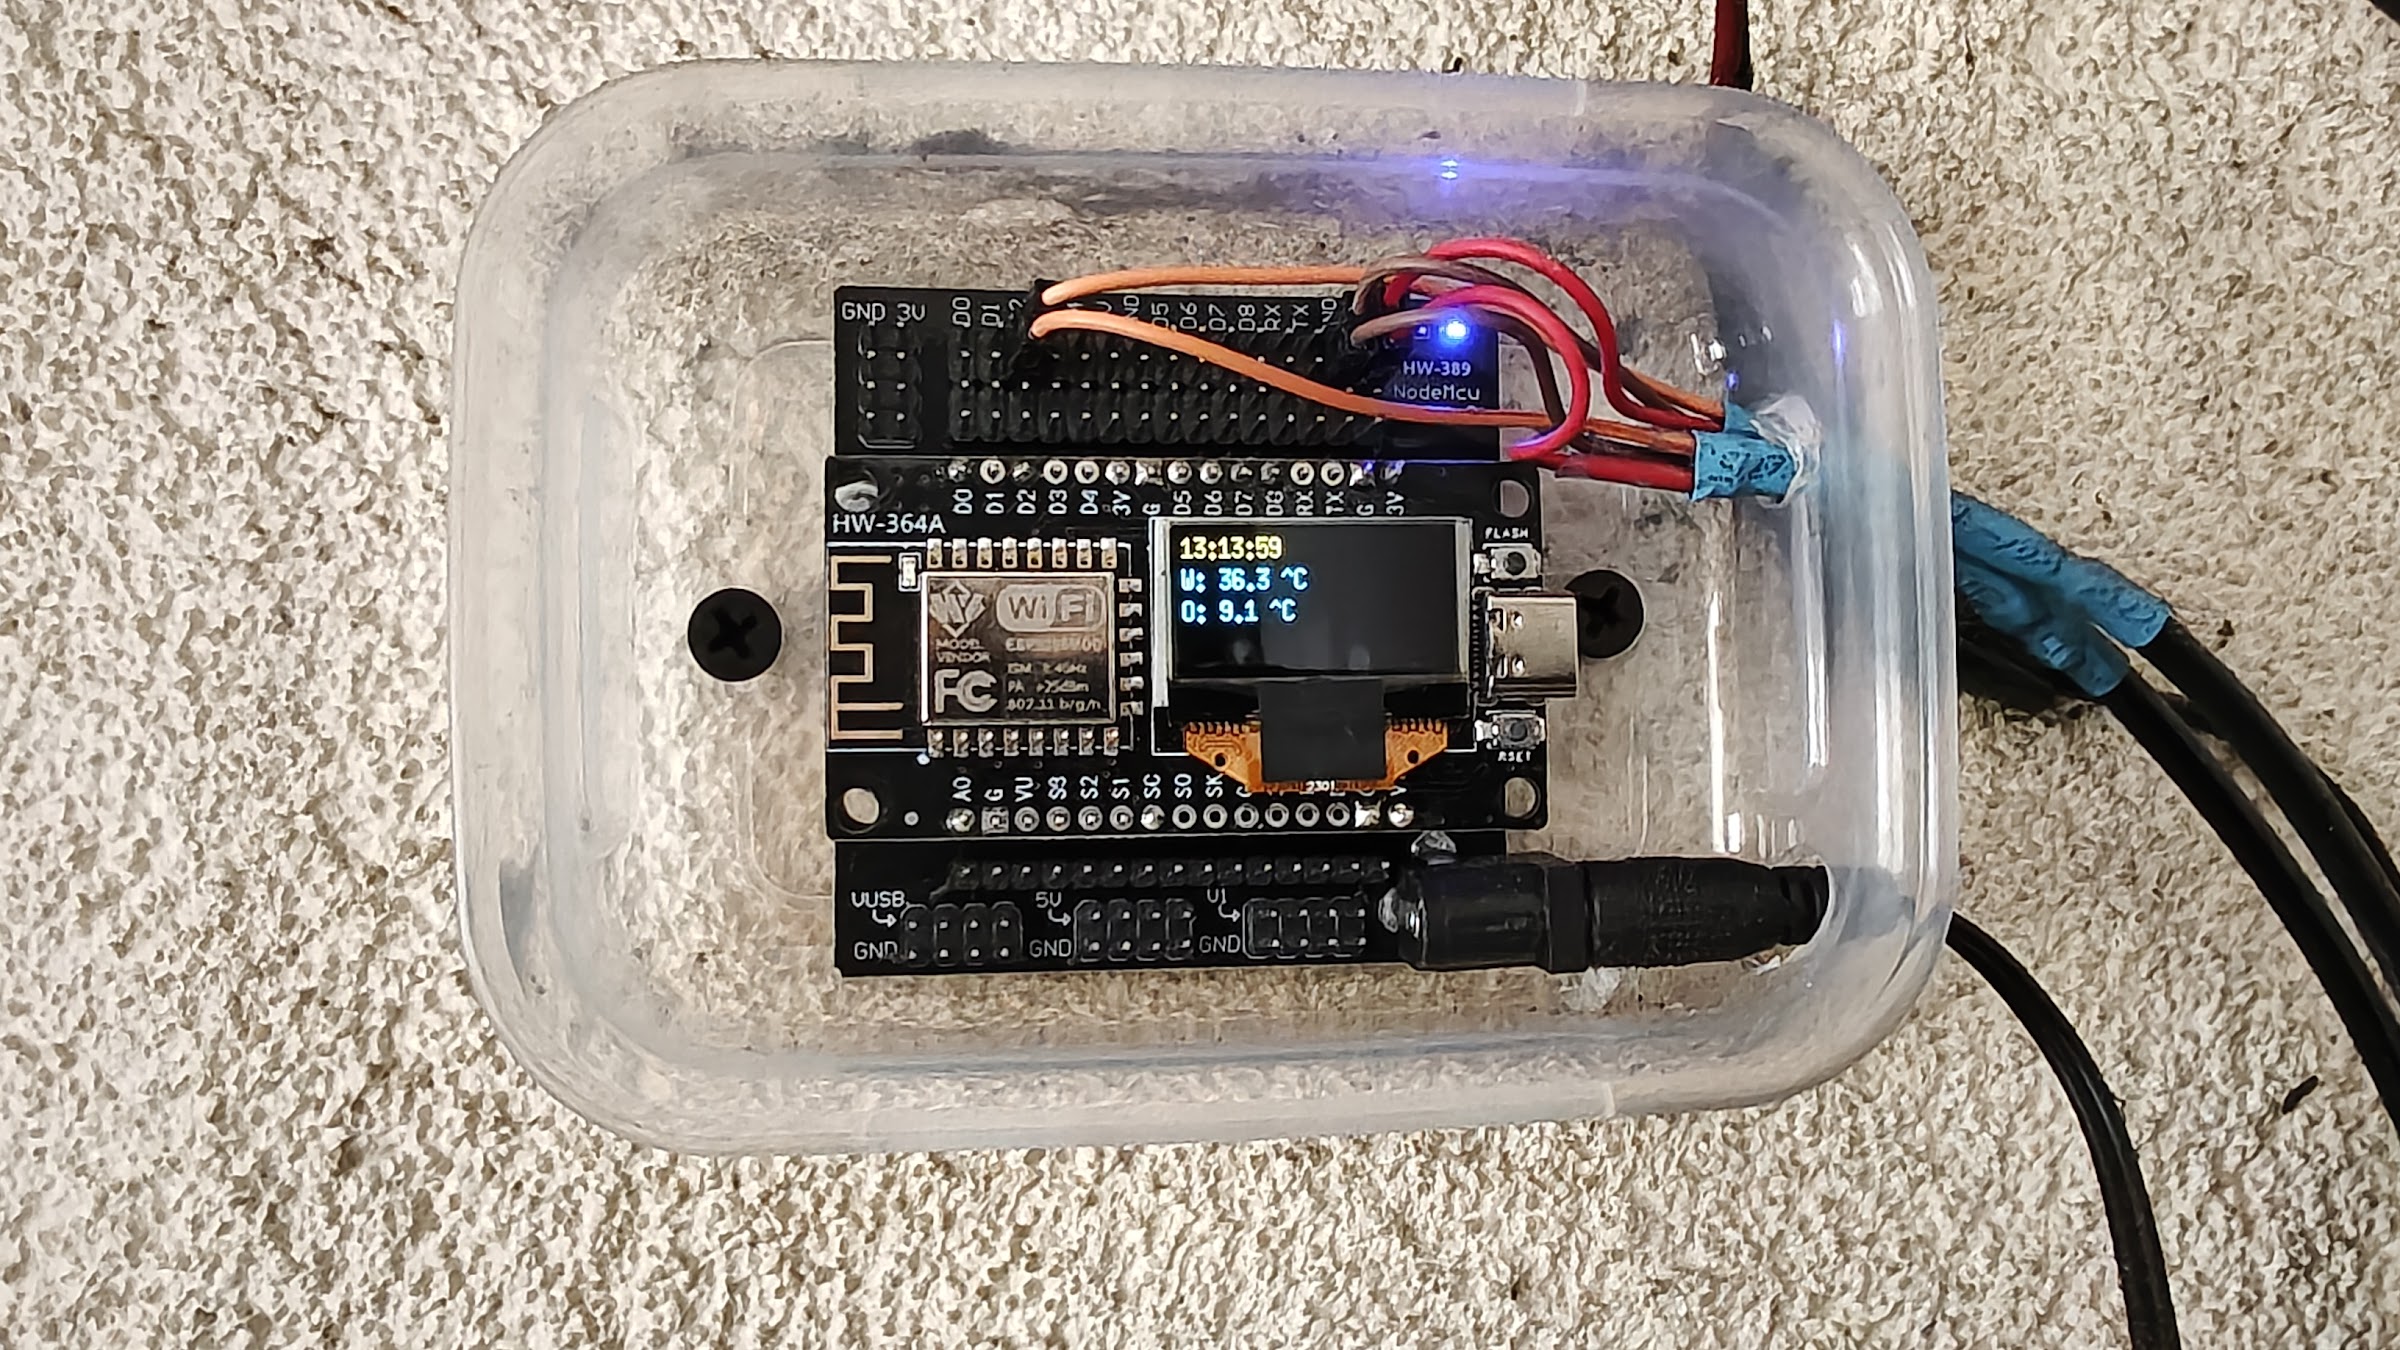
NodeMCU connects to wifi and reads the temperatures from the sensors in different timings. Then these values are also displayed in the integrated display of the NodeMCU. When the timing is ok, it sends the temperatures to the supabase database.
Because the temperatures are stored in different time intervals, like every 2 minutes fro boiler temp, and every 30 minutes for outside temp, these values are stored in two separate tables in supabase. Also there is a cron set to clear out the data after a given time period on supabase.
The PWA is a NextJs app which reads the data from supabase and displays it. Displays both the temperatures, and a chart with the history for both of them.
NodeMCU and the sensors
For NodeMCU I am using a helper board, which holds the board, and has the possibility to power with 12V. The board i bought from Aliexpress. If you search for NodeMCU Expansion Board it will give a lot if results. This is optional.
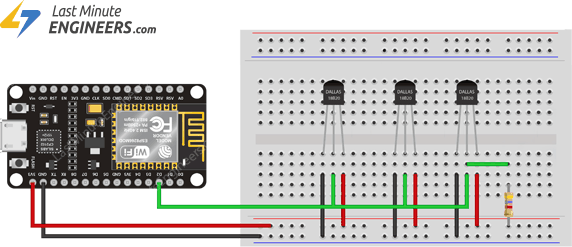
The wiring i got form here: https://lastminuteengineers.com/multiple-ds18b20-esp8266-nodemcu-tutorial/
So lets talk about the software.
The git repository with all the source code can be found here: https://github.com/fzsatti/nodemcu-boiler-room
For start there is a need for a wifi connection, where you know the name and the password. This needs to be given to NodeMCU to be able to connect. Then a Supabase account needs to be created, and needs the project url, key and also a user with an email and password. After all these are given everything is ready for the project to run.
The code does the following:
- Initializes sensors and display
- Connects to wifi and waits until connection is made and network is available
- Main loop starts:
- In every minute check if network is available, if not wait until will be available
- In every second get the current time and display it
- In every 2 minutes get the water temperature and send it to the server
- In every 30 minutes get the outside temperature and send it to the server
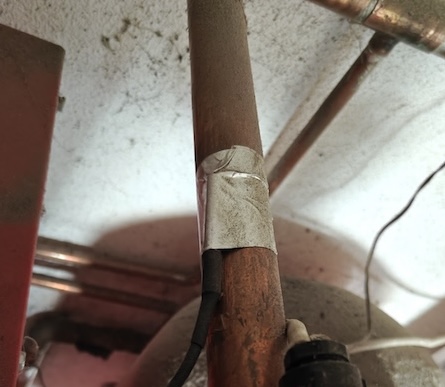
This is how the thermometer is connected to the copper pipe:
Supabase
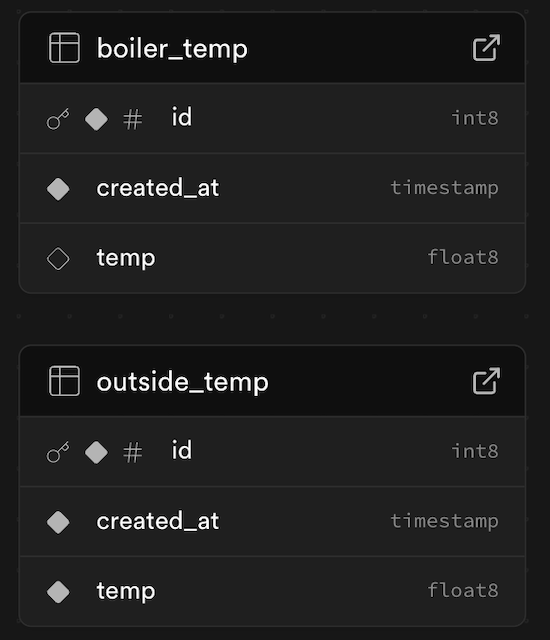
This is the DB structure:
On the authentication part there are two users created, ofe for the NodeMCU, and one for the PWA. This way only those users have access to the tables. To ensure this, on the policies are set that only the authenticated users can read or insert.
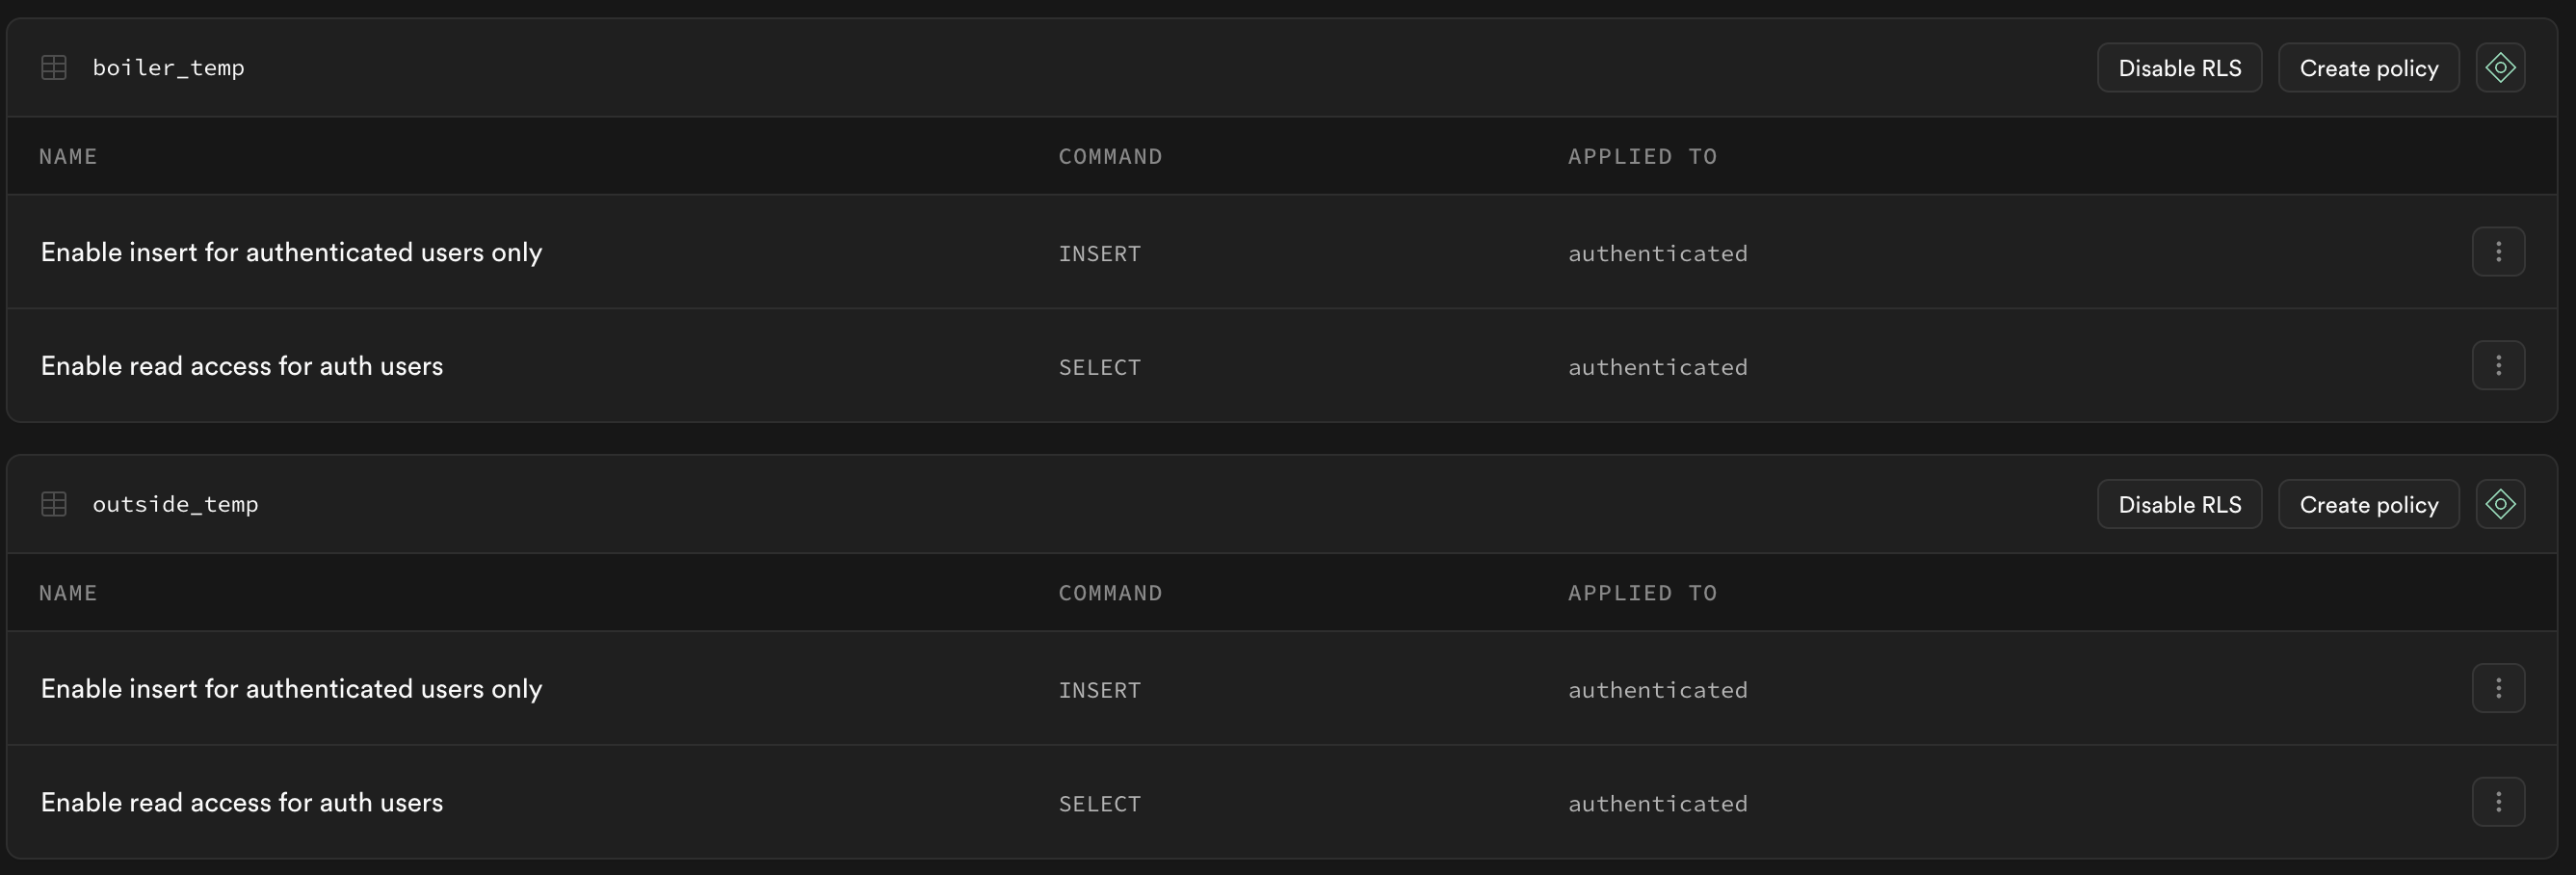
On the integrations part, there are two cronjobs added, which run every day and delete the data which is too old:
DELETE FROM boiler_temp WHERE created_at < NOW() - INTERVAL '7 days';
DELETE FROM outside_temp WHERE created_at < NOW() - INTERVAL '31 days';
PWA
The PWA is made in NextJs. I am more deeply into backend than frontend, so this was made mostly with Chat GTP. Basically Chat GTP made a single page, and i refactored it to modules, and organized how i thought it is ok.
Here is the github link to it: https://github.com/fzsatti/zsolts-home-temp-dashboard
It has an auth gate, so without login it asks for credentials. After login saves the token to local storage, and using that queries the data from supabase.
It has two charts, one for boiler temp and one for outside temp, with different intervals for filter for, for each chart.
This is how it looks like:
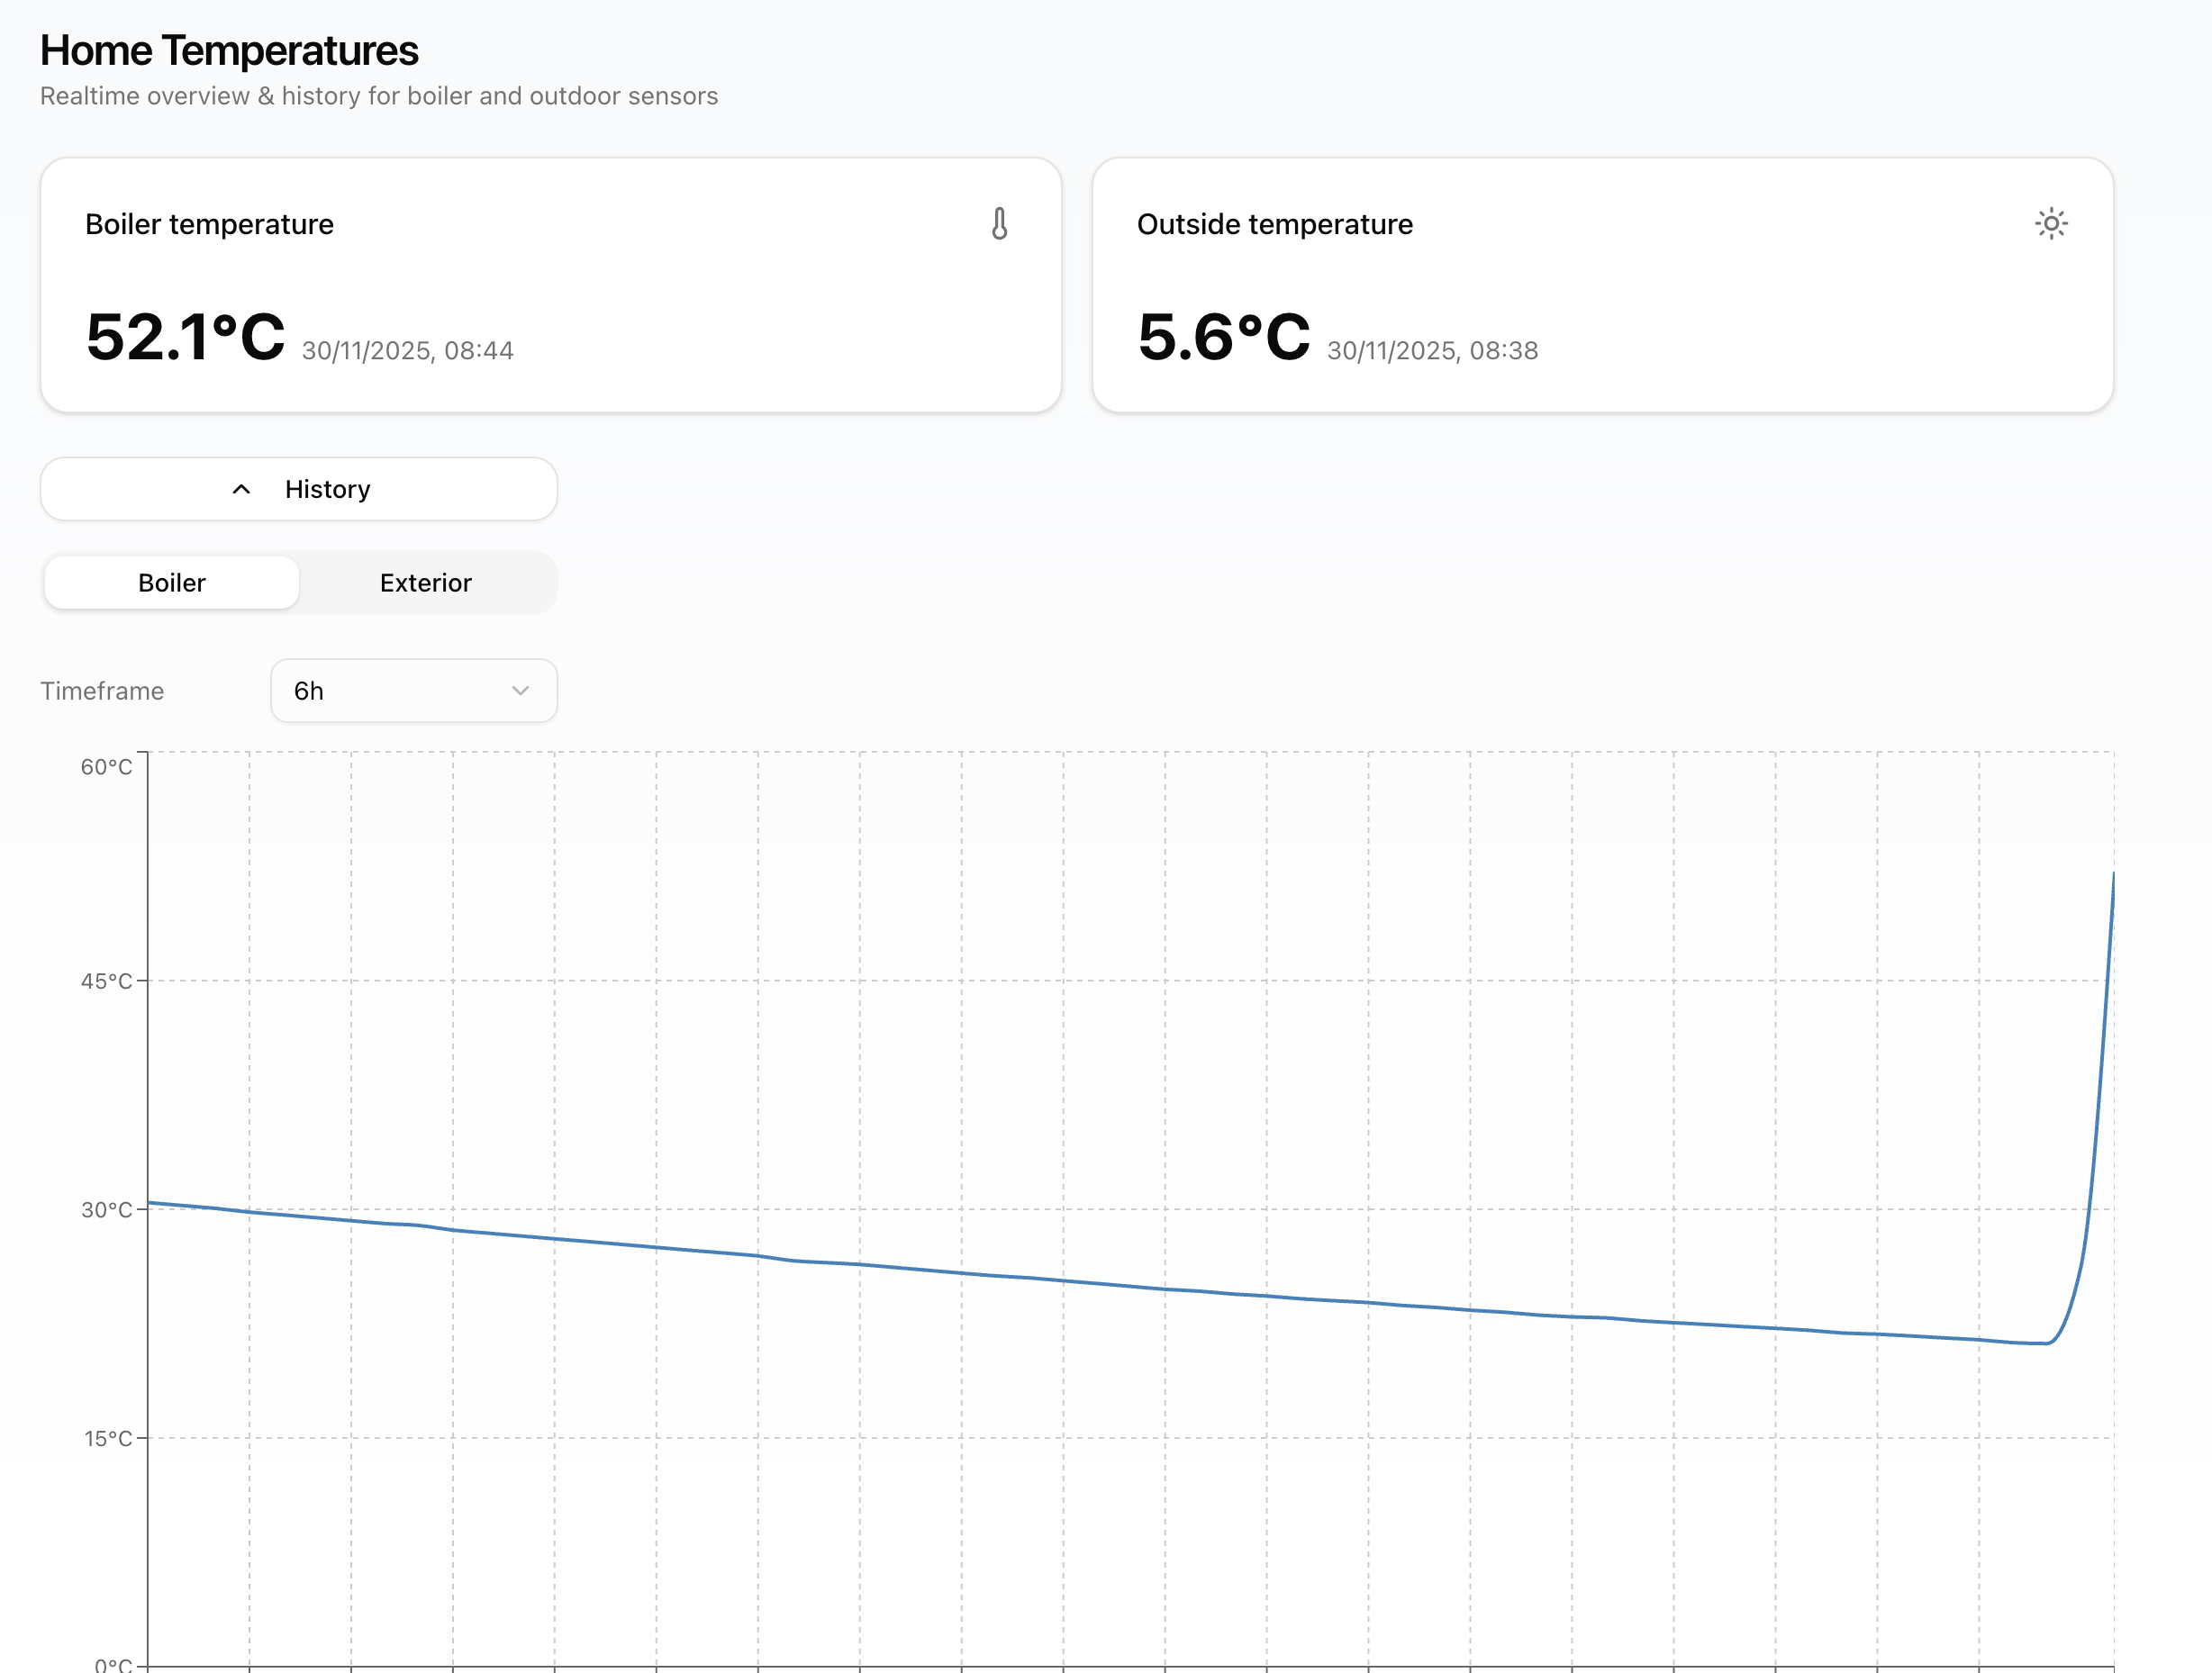
Because it is a PWA it can be installed to mobile or desktop.
Summary
As following improvement on the NodeMCU module, I am thinking to add a button, and only turn on the display for 10 seconds after the button is pressed, because currently the display is always on.
I am also thinking to add more temperature sources, like room temperatures, but that is a bit complicated, because it would be nice the have the sensors to be somewhere hidden, and powered by a battery, which lasts long.
It was a nice little project, and I learned a lot about NodeMCU programming, as this is the first time when i program such kind of a device.mak